
This report provides a snapshot of Child Care Subsidy (CCS) approved care over the June quarter 2026.
On this page:
About this report
The June quarter 2026 report includes data on:
- the number of children and families using approved care
- the number and types of approved services
- the cost of care
- total government subsidies.
The report covers the four approved care types that administer CCS.
In Home Care has been excluded from all service type, state and usage analysis for privacy reasons.
Learn about the data, including sources, definitions and technical notes
Detailed findings
Children
1,456,930 children from 1,049,450 families attended a CCS approved service.
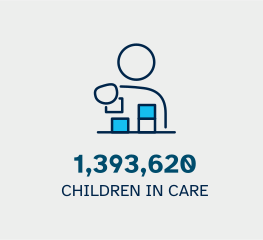
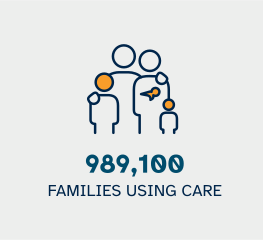
1,393,620 children from 989,100 families were allocated a Customer Reference Number (CRN) by Services Australia, down -2.1% of children from June quarter 2025. The remainder of this report analyses this cohort.
47.8% of children aged 0 to 5 and 33.7% of children aged 0 to 12 used approved care.
Of children in care:
- 56.2% (783,860 children) attended Centre Based Day Care
- 41.0% (571,580 children) attended Outside School Hours Care
- 4.5% (62,820 children) attended Family Day Care.
New South Wales had the largest share of children attending approved care, at 31.9% or 444,500 children. Australian Capital Territory had the largest proportional decrease, at -4.0% or -1,220 children.
47,180 children accessed Additional Child Care Subsidy.
| State or territory | Percentage of children using approved care |
|---|---|
| New South Wales | 31.90 |
| Victoria | 25.00 |
| Queensland | 22.90 |
| South Australia | 6.80 |
| Western Australia | 9.00 |
| Tasmania | 1.70 |
| Northern Territory | 0.80 |
| Australian Capital Territory | 2.10 |
68,140 Aboriginal and Torres Strait Islander children attended approved care, up 2.5% from June quarter 2025.
New South Wales had the largest share of Aboriginal and Torres Strait Islander children attending approved care, at 37.6%.
The majority of Aboriginal and Torres Strait Islander children using care attended Centre Based Day Care, at 66.9%. This compares with 56.2% for all children in care.
31.0% of Aboriginal and Torres Strait Islander children using approved care attended Outside School Hours Care, compared to 41.0% of all children.
| Care type | All children | Indigenous children |
|---|---|---|
| Centre Based Day Care | 56.20 | 66.90 |
| Family Day Care | 4.50 | 3.50 |
| Outside School Hours Care | 41.00 | 31.00 |
Families
989,100 families used approved care, down -1.7% from June quarter 2025.
The number of families using Centre Based Day Care decreased by -2.6% (-17,240 families). The number of families using Outside School Hours Care decreased by -0.4% (-1,620 families).
New South Wales had the largest share of families using Centre Based Day Care, at 32.6% (212,740 families).
34,000 families accessed Additional Child Care Subsidy.
183,590 families accessed Multi Child Subsidy.
| Care type | Percentage of approved services |
|---|---|
| Centre Based Day Care | 64.50 |
| Family Day Care | 2.10 |
| Outside School Hours Care | 33.20 |
| In Home Care | 0.20 |
Services
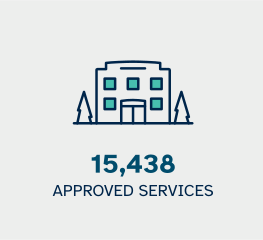
15,438 approved services operated during the quarter.
Centre Based Day Care services represented 64.5% of all services, with 9,963 services. Outside School Hours Care services represented 33.2% of all services, with 5,125 services.
Compared to June quarter 2025:
- the number of Centre Based Day Care services increased by 2.9% (279 services)
- the number of Outside School Hours Care decreased by -0.4% (-23 services)
- the number of Family Day Care decreased by -8.5% (-30 services).
| Care type | Percentage of approved services |
|---|---|
| Centre Based Day Care | 64.50 |
| Family Day Care | 2.10 |
| Outside School Hours Care | 33.20 |
| In Home Care | 0.20 |
Usage
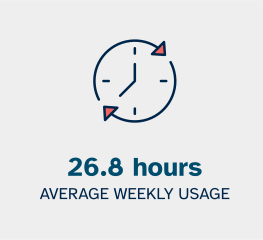
On average, children attended 26.8 hours of care per week, up 0.3% from June quarter 2025.
Of Centre Based Day Care services:
- Northern Territory had the highest average weekly hours, at 39.1 hours
- Tasmania had the lowest average weekly hours, at 27.6 hours.
| State or territory | Average weekly hours |
|---|---|
| New South Wales | 34.2 |
| Victoria | 34.3 |
| Queensland | 37.6 |
| South Australia | 31.9 |
| Western Australia | 30 |
| Tasmania | 27.6 |
| Northern Territory | 39.1 |
| Australian Capital Territory | 33.9 |
| Australia | 34.4 |
Fees
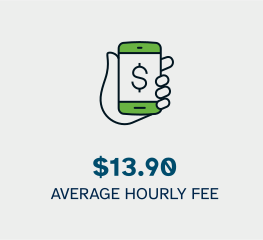
The average hourly fee was $13.90, up 3.8% from June quarter 2025.
Outside School Hours Care had the lowest average hourly fee at $10.05 per hour. Centre Based Day Care had the highest at $14.60 per hour.
| Care type | Average hourly fee |
|---|---|
| Centre Based Day Care | 14.6 |
| Family Day Care | 13.95 |
| Outside School Hours Care | 10.05 |
| Total | 13.9 |
The hourly rate cap for children below school age at Centre Based Day Care services was $14.63. The Australian Capital Territory ($16.50), Western Australia ($14.90), New South Wales ($14.85) and Victoria ($14.65) had average hourly fees above the hourly rate cap for Centre Based Day Care.
Nationally, 56.7% of Centre Based Day Care services had an average hourly fee under or at the hourly fee cap. This compares to 81.6% in Outside School Hours Care under a fee cap of $12.81, and 45.2% under a cap of $13.56 in Family Day Care.
| State or territory | Average hourly fee |
|---|---|
| New South Wales | 14.85 |
| Victoria | 14.65 |
| Queensland | 14.15 |
| South Australia | 14.1 |
| Western Australia | 14.9 |
| Tasmania | 13.35 |
| Northern Territory | 13.2 |
| Australian Capital Territory | 16.5 |
| Australia | 14.6 |
Subsidies
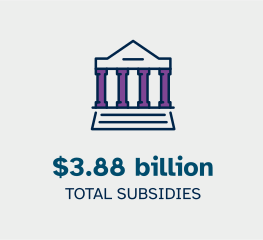
The total estimated expenditure by the Australian Government was $3.88 billion. This includes Child Care Subsidy and Additional Child Care Subsidy.
Additional Child Care Subsidy accounted for $227.7 million of this.
The total estimated expenditure was up 0.7% from June quarter 2025.
The majority of Child Care Subsidy went to families using Centre Based Day Care, at $3.31 billion or 85.1%.
9.9% went to families using Outside School Hours Care.
| Care type | Estimated Child Care Subsidy |
|---|---|
| Centre Based Day Care | 85.10 |
| Family Day Care | 4.80 |
| Outside School Hours Care | 9.90 |
| In Home Care | 0.20 |